About This ProjectThis website presents the findings of a small-scale research project into public awareness, attitudes and behaviour around water scarcity in South Africa. The project was carried out using a short questionnaire that was distributed online and completed by twenty respondents. Their answers were captured in two separate formats for analysis: a Microsoft Excel workbook and a Microsoft Access database. This site reports the key findings drawn from each of those two sources. South Africa is classified as a water-scarce country, receiving roughly half the world’s average annual rainfall. Rapid population growth, ageing municipal infrastructure, recurring drought cycles and rising urban demand have combined to place sustained pressure on the country’s water resources. Understanding how ordinary residents perceive this problem, where they get their information, and what they are (or are not) doing to save water is an important step toward designing better public awareness campaigns and policy responses.
Why Water Scarcity MattersWater scarcity affects almost every part of daily life – from household chores and sanitation to agriculture, industry and public health. Some of the key drivers and consequences explored by this research include:
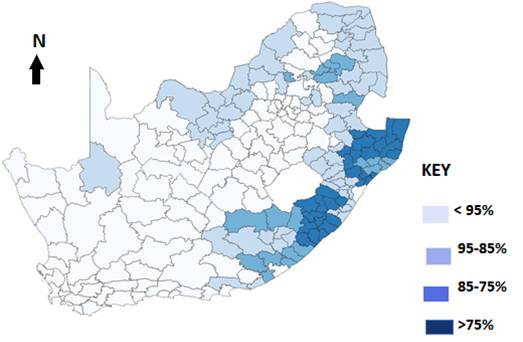
Figure showing the water stressed regions in South Africa, with the water stress in percentages. About the DataTwenty respondents completed a ten-question survey covering awareness of water scarcity, perceived severity, information sources, household consumption estimates, water-saving habits, prior experience of restrictions, opinions on government action, and open-ended suggestions for reducing water scarcity nationally. The same underlying responses were processed in two different tools, each explored on its own page of this site:
How to Use This SiteUse the navigation list at the top of every page to move between the home page and the two findings pages. The same navigation bar, colour scheme and font styling are used throughout the site so that the project reads as a single, consistent report. |