Key Findings – Excel Questionnaire Processing
|
The Excel sheet contains the twenty raw survey
responses on a Raw Data sheet, a Processed Data sheet where each answer option
has been converted into a count, and three chart sheets built directly from those counts.
The ten questions covered awareness, perceived severity, information sources, household
consumption, saving behaviour, past experience of restrictions, opinion of government action,
and suggested solutions. The tables and charts below summarise the response for each
question.
|

|
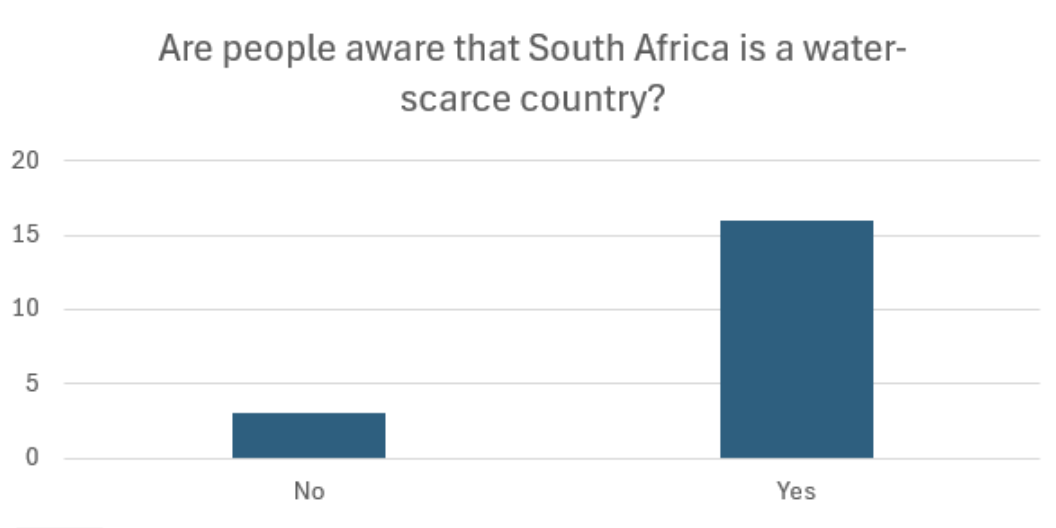
Q1. Are you aware that South Africa is a water-scarce country?
|
|
Response
|
Count
|
|
Yes
|
17
|
|
No
|
3
|
85% of respondents were already aware that South Africa is classified as water-scarce, suggesting the basic message is reaching most people.
|
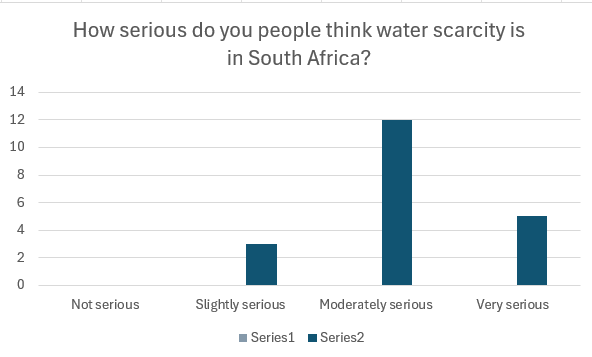
Q2. How serious do you think water scarcity is in South Africa?
|
|
Response
|
Count
|
|
Not serious
|
0
|
|
Slightly serious
|
3
|
|
Moderately serious
|
12
|
|
Very serious
|
5
|
No respondent considered the issue “not serious”. Sixty percent rated it moderately serious, and a further quarter rated it very serious.
|
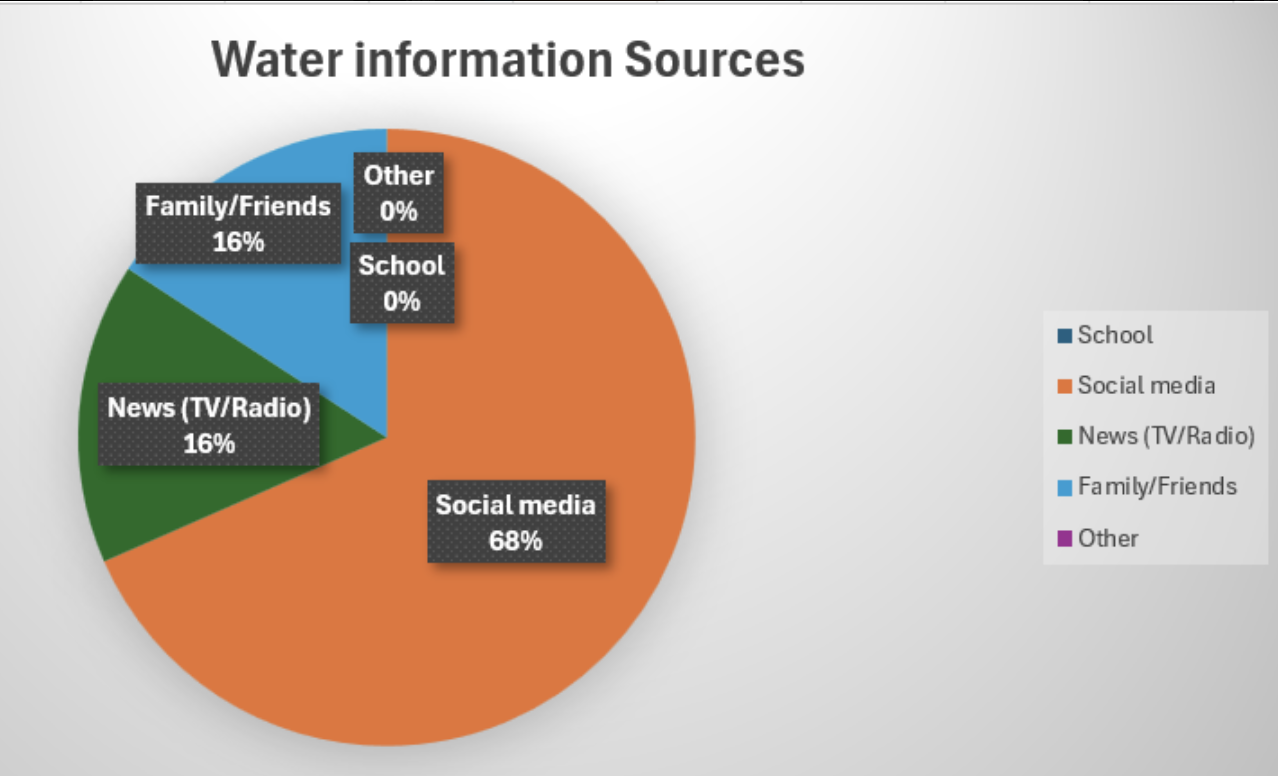
Q3. Where do you mostly get information about water issues?
|
|
Source
|
Count
|
|
Social Media
|
13
|
|
News (TV/Radio)
|
4
|
|
Family/Friends
|
3
|
|
School / Other
|
0
|
Social media is by far the dominant information channel, cited by 65% of respondents – more than news and family/friends combined.
|
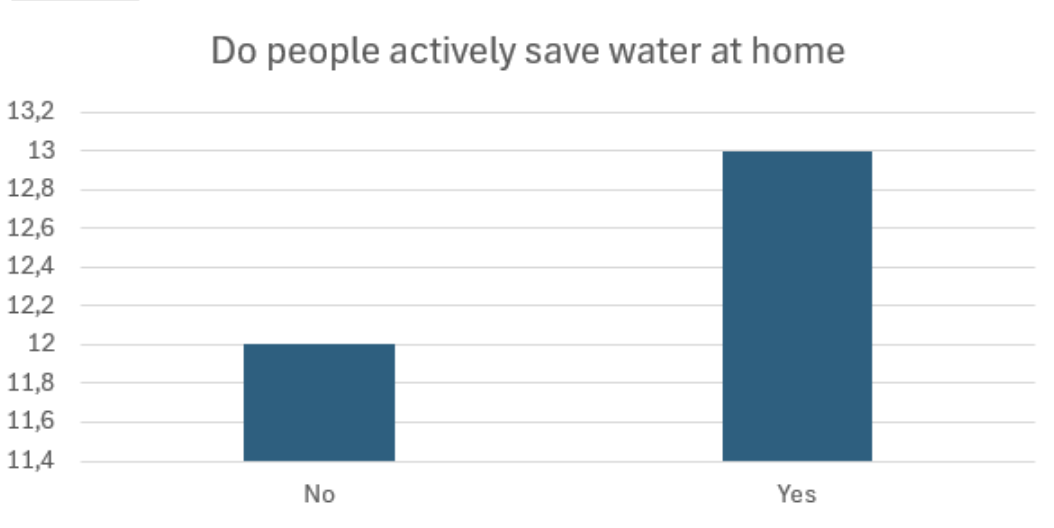
Q4. Do you actively save water at home?
|
|
Response
|
Count
|
|
Yes
|
13
|
|
No
|
7
|
Almost two thirds of respondents report actively saving water, leaving a meaningful gap between awareness (85%) and reported action (65%).
|
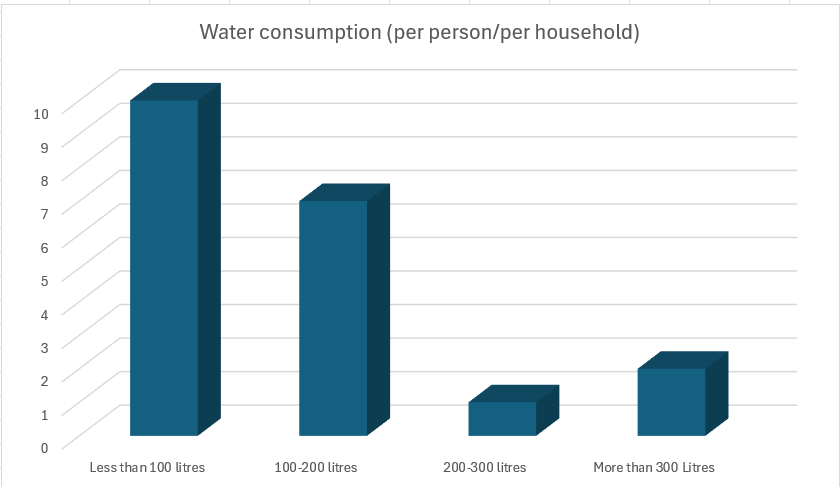
Q5. How many litres of water do you think you use at home per day?
|
|
Estimate
|
Count
|
|
Less than 100 litres
|
10
|
|
100–200 litres
|
7
|
|
200–300 litres
|
1
|
|
More than 300 litres
|
2
|
Half of all respondents believe they use less than 100 litres per day – well under typical household estimates – which may point to limited awareness of actual consumption.
|
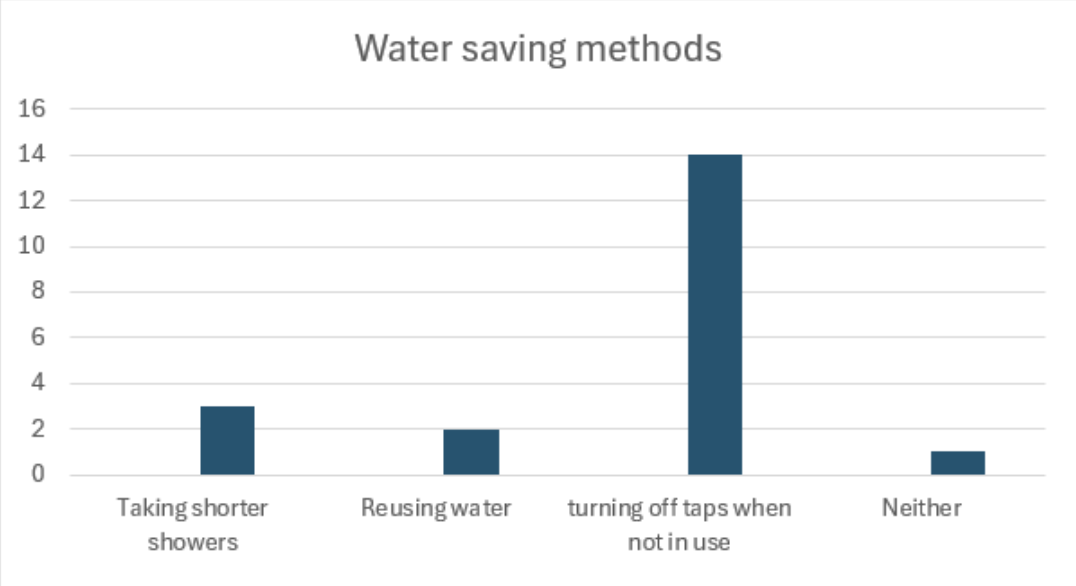
Q6. Which water-saving methods do you use?
|
|
Method
|
Count
|
|
Turning off taps when not in use
|
14
|
|
Taking shorter showers
|
3
|
|
Reusing water (e.g. greywater)
|
2
|
|
Neither
|
1
|
Turning off taps is the clear favourite, used by 70% of respondents; more resource-intensive habits such as water reuse remain rare.
|
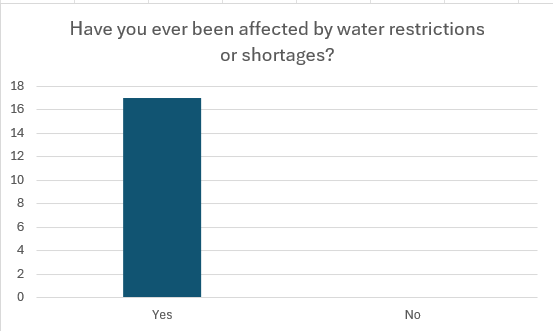
Q7. Have you ever been affected by water restrictions or shortages?
|
|
Response
|
Count
|
|
Yes
|
17
|
|
No
|
3
|
85% of respondents have personally experienced restrictions or shortages, showing the issue is not abstract for most of this sample.
|
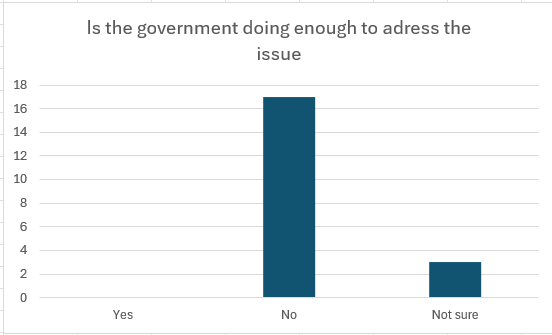
Q8. Do you think the government is doing enough to address water scarcity?
|
|
Response
|
Count
|
|
Yes
|
0
|
|
No
|
17
|
|
Not sure
|
3
|
Not a single respondent felt the government is doing enough – the strongest and most one-sided result in the whole survey.
|
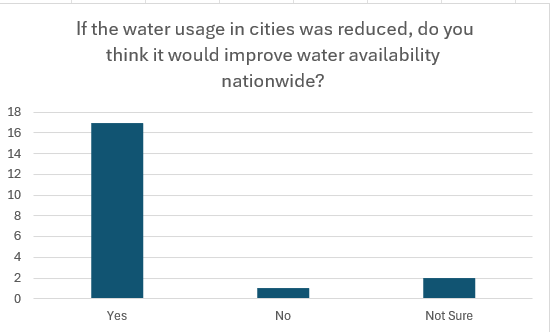
Q9. If water usage in cities was reduced, would it improve water availability nationwide?
|
|
Response
|
Count
|
|
Yes
|
17
|
|
Not sure
|
2
|
|
No
|
1
|
There is strong consensus (85%) that reducing urban water usage would improve availability nationwide.
|
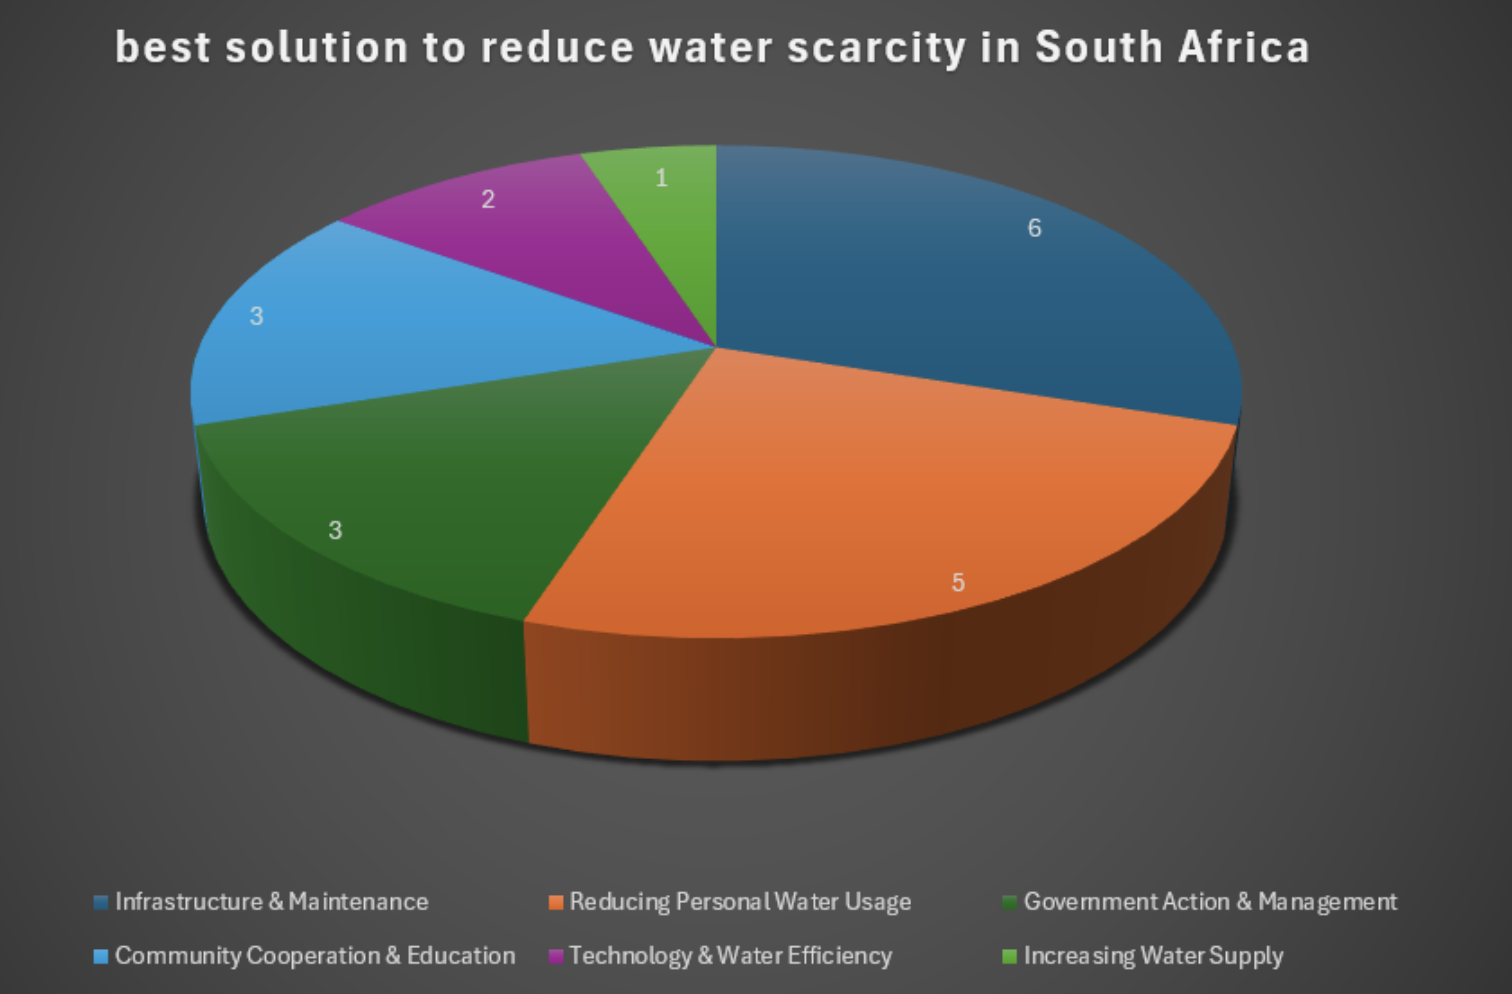
Q10. What do you think is the best solution to reduce water scarcity in South Africa?
This question was open-ended. Each written answer was read and grouped into one of six
recurring themes during processing, shown in the chart and table below.
|
|
Theme
|
Count
|
|
Infrastructure & Maintenance
|
6
|
|
Reducing Personal Water Usage
|
5
|
|
Government Action & Management
|
3
|
|
Community Cooperation & Education
|
3
|
|
Technology & Water Efficiency
|
2
|
|
Increasing Water Supply
|
1
|
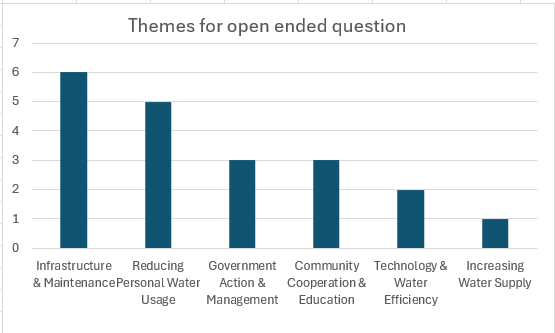
Fixing and maintaining existing infrastructure was the single most common suggestion, ahead of calls for personal behaviour change.
|
Open-Ended Responses
The final question was open-ended, and each answer was reviewed and grouped into six recurring categories. These categories are shown in the chart below:
-
Infrastructure & Maintenance
-
Reducing Personal Water Usage
-
Government Action & Management
-
Community Cooperation & Education
-
Technology & Water Efficiency
-
Increasing Water Supply
Summary of Key Findings
- Awareness of South Africa’s water-scarce status is high (85%), and most respondents rate the issue as moderately to very serious.
- Social media is the leading source of information on water issues, well ahead of news and family/friends.
- There is a gap between awareness (85%) and reported water-saving action (65%).
- Turning off taps when not in use is the dominant water-saving habit; more advanced methods such as reuse are rare.
- 85% of respondents have personally experienced water restrictions or shortages.
- No respondent believes the government is doing enough – the strongest finding in the survey.
- There is near-unanimous agreement that reducing urban water usage would help nationwide.
- When asked for solutions, infrastructure repair and maintenance was the most frequently proposed answer, followed by personal usage reduction.
|